Sales + Property Taxes
Overland Park uses revenue from sales and property taxes to support its operating budget.
Property Tax Rebate Program
The City of Overland Park offers a property tax rebate program to eligible Overland Park residents. The program’s goal is to help those in need of assistance continue to afford to live in their homes.
The program offers a rebate of up to 75% of city property taxes.
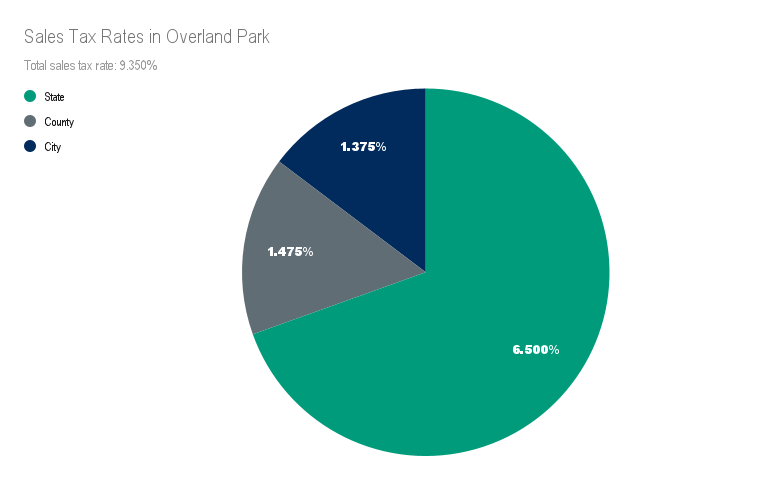
Sales Tax
The sales tax rate in Overland Park is 9.35 percent.
Sales tax is collected on the purchase of tangible goods and services.
Transportation development districts and community improvement districts can increase sales tax at some businesses within their boundaries. Learn more about Overland Park’s economic development incentives.
Overland Park has a one-cent sales tax supporting general operations and a 3/8 cent sales tax for street improvements.
The city also receives a portion of select county sales taxes. The remainder and the majority of sales taxes go to county and state services.
Almost half of the city’s annual revenue comes from sales taxes.
Certain foods are subject to reduced sales tax rates. For additional information, see the Kansas Department of Revenue’s Publication KS-1223 or contact the Kansas Department of Revenue.
Property Tax
Overland Park’s property tax rate is 14.538 mills.
Property taxes are levied on real estate and property, and help support services, including:
- Public safety
- Snow removal
- Street repair
- Animal control
- Parks and Recreation programs
- Debt payment
A property’s total tax rate includes levies for the State of Kansas, Johnson County, the respective school district and Johnson County Community College.
Overland Park receives around 13 percent of the total property tax paid by each property in Overland Park.
Overland Park’s tax rate is significantly less than our neighboring communities and remains the lowest of any first-class city in Kansas.
| 2024 Mills for 2025 Budget | |
|---|---|
| City of Overland Park | 14.538 |
| Johnson County | 17.286 |
| Johnson County Parks & Recreation | 3.023 |
| Johnson County Library | 3.816 |
| Johnson County Community College | 8.124 |
| School Districts | |
| Blue Valley Olathe Shawnee Mission Spring Hill |
53.596 63.198 51.335 67.087 |
| Recreation Commissions: | |
| Blue Valley Spring Hill |
2.856 3.050 |
| State of Kansas | 1.500 |
Calculating Property Tax
Property tax rates are based on mills and are assessed through a mill levy. One mill is equivalent to $1 for every $1,000 of assessed property value.
The Johnson County Appraiser’s Office maintains property valuations and tax bills.
Calculating Property Tax
Assessed property values are 11.5 percent of appraised (market) value for residential properties and 25 percent for commercial properties.
Example: A home appraised at $300,000 has an assessed value of $34,500. This amount is divided by $1,000 because one mill is equivalent to $1 for every $1,000 of assessed property value.
The assessed value is then multiplied by the mills for the home’s taxing entities to arrive at the total property tax amount.
Overland Park’s property tax rate is 14.538 mills.
Example: The same home’s assessed value is multiplied by 14.538 mills. $34,500/$1,000 x 14.538 = $501.56. This is Overland Park’s portion of the overall tax bill.
Example: The same homeowner also pays property taxes to other organizations listed above. The overall tax bill uses the same format for determining tax bills, so the overall tax bill would range between $3,359 and $4,086.
Overland Park’s portion of the overall tax bill is approximately 13 percent.
Property Tax Rate Comparisons
Overland Park maintains the lowest property tax rate in Johnson County and among first-class cities in Kansas, while providing a high-quality level of city services.
The tables below show Overland Park’s property tax rate as compared to other cities’ rates and services.
- Johnson County Tax Rates
City City Mill Levy Additional Levy (for JCFD #2) Total Levy Difference from OP (Mills) Percent of OP Levy Overland Park 14.538 – 14.538 0 100% Lake Quivira 19.628 – 19.628 5.103 135% Merriam 22.929 – 22.929 8.404 158% Shawnee 23.048 – 23.048 8.523 159% Olathe 23.356 – 23.356 8.831 161% Leawood 23.506 – 23.506 8.981 162% Mission Woods 14.290 10.007 24.297 9.772 167% Lenexa 27.470 – 27.470 12.945 189% Prairie Village 18.325 10.007 28.332 13.807 195% Mission 18.497 10.007 28.504 13.979 196% Edgerton 29.753 – 29.753 15.228 205% Fairway 19.972 10.007 29.979 15.454 206% Westwood 21.199 10.007 31.206 16.681 215% Mission Hills 22.766 10.007 32.773 18.248 226% Gardner 18.319 14.637 32.956 18.431 227% Westwood Hills 23.153 10.007 33.160 18.635 228% Roeland Park 26.000 10.007 36.007 21.482 248% Spring Hill 36.242 – 36.242 21.717 250% De Soto 19.711 19.765 39.476 24.951 272% Bonner Springs 39.870 – 39.870 25.345 274% This information supports 2024 budget numbers.
- First Class City Tax Rates
City 2021 Population Mill Levy Rate Difference from OP Overland Park 197,106 14.573 0 Atchinson 10,694 54.374 39.801 Coffeyville 8,847 52.791 38.218 Derby 25,847 46.978 32.405 Dodge City 27,690 43.448 28.875 Emporia 24,009 44.426 29.853 Fort Scott 7,513 45.241 30.668 Garden City 27,856 23.805 23.805 Hutchinson 39,712 41.555 26.982 Junction City 22,429 48.311 33.738 Kansas City 154,545 38.477 23.904 Lawrence 95,256 33.207 18.634 Leavenworth 37,176 28.327 13.754 Leawood 33,743 24.077 9.504 Lenexa 58,388 28.122 13.549 Liberal 19,640 55.635 41.062 Manhattan 54,763 52.154 37.581 Newton 18,433 70.383 55.810 Olathe 143,014 24.012 9.439 Parsons 9,479 58.112 43.539 Pittsburg 20,738 50.896 36.323 Prairie Village* 22,878 28.786 14.213 Salina 46,481 30.348 15.775 Shawnee 67,511 24.047 9.474 Topeka 125,963 38.963 24.390 Wichita 395,699 29.368 14.795 This information comes from the League of Kansas Municipalities and supports 2023 budget numbers.
*Includes fire service levy of 10.477 mills.